The LogProduct
Set and Drift Calculation: A Practical Guide for Mariners
Master set and drift calculation with our practical guide. Learn the steps to plot vectors effectively for accurate maritime navigation.
Drift (knots) = Distance between DR position and observed fix (nm) ÷ elapsed time (hours). Set is the true bearing measured from your DR position to the observed fix. The full process takes three steps: plot your dead-reckoning (DR) endpoint, plot the observed fix, then draw the vector from DR to fix. That vector’s bearing is your set; its length converted to knots is your drift.
- Drift formula: Drift (kn) = DR-to-fix distance (nm) ÷ elapsed time (hours)
- Set: True bearing from DR endpoint to observed fix (degrees true)
- One-line process: Plot DR, plot fix, draw the current vector (DR → fix), measure bearing for set, divide vector length by hours for drift
This is the vector plotting method used on charts, maneuvering boards, and radar plotting sheets worldwide. Everything below unpacks that process with the math, a numeric example, and the checks that keep the result trustworthy.
Key Takeaways
Accurate set and drift calculation requires valid inputs, a clean vector from DR endpoint to observed fix, and a manual verification habit that no calculator can replace.
| Point | Details |
|---|---|
| Core drift formula | Drift (kn) = distance from DR to fix (nm) ÷ elapsed time in decimal hours. |
| Set is a bearing, not a speed | Measure the true bearing from your DR endpoint to the observed fix to get set in degrees true. |
| Time conversion is critical | Always convert minutes to decimal hours before dividing; 45 min = 0.75 h, not 0.45 h. |
| Manual plots validate electronics | Periodic manual plots catch input errors that automated tools silently accept and amplify. |
| Nausika for live current data | Nausika feeds validated real-time current vectors to your AI assistant, reducing input errors at the source. |
Table of Contents
- What inputs do you need before the set and drift calculation?
- How to calculate set and drift step by step
- Worked example: plotting set and drift from a real scenario
- Which tools make the calculation faster and more reliable?
- Common errors that corrupt your set and drift result
- How experienced navigators use set and drift proactively
- Quick-reference formulas and unit conversions
- Why manual skills still matter more than the tools
- Real-time currents and validated data with Nausika
- Sources
What inputs do you need before the set and drift calculation?
Before you touch a chart or calculator, you need five things in hand. Missing any one of them produces a vector that points nowhere useful.
Minimum required inputs:
- DR start position — the lat/lon where you began tracking (your last confirmed fix)
- Course steered — your compass course corrected for variation and deviation, expressed as a true course
- Speed through water — from your knotmeter or engine RPM table, not GPS speed
- Elapsed time — the interval from DR start to the observed fix, in decimal hours (30 minutes = 0.5 h)
- Observed fix — lat/lon from a GPS, visual bearing cross, radar range, or celestial sight, with its exact time
Definitions that matter:
Set is the direction the current is carrying your vessel, expressed in degrees true. If set is 090°T, the current is pushing you east. Drift is how fast that current moves, in knots.
Two terms trip up students regularly. Leeway is the sideways slip caused by wind pressure on the hull and rig. It is not drift. Drift is water movement; leeway is aerodynamic. Both displace your vessel from the intended track, but they require separate corrections. SOG (speed over ground) and CMG (course made good) describe what your vessel actually achieved over the ground, combining your water-track vector with the current vector. They are outputs of the calculation, not inputs.
Time format matters more than it seems. Always convert minutes to decimal hours before dividing. Forty-five minutes is 0.75 h, not 45. Feeding raw minutes into the drift formula inflates the result by a factor of 60.
How to calculate set and drift step by step
The plotting workflow taught in nautical science follows a clean four-step sequence. You can execute it on a paper chart, a maneuvering board, or a spreadsheet.
-
Compute DR distance. Multiply speed through water (knots) by elapsed time (decimal hours). A vessel doing 6.0 kn for 1.5 h advances 9.0 nm along the steered course.
-
Plot the DR endpoint. From your start position, lay off the true course and mark the DR endpoint at the computed distance. Use parallel rulers or a navigation triangle to transfer the course line accurately.
-
Plot the observed fix. Mark the fix on the same chart or plotting sheet. This is your actual position at the end of the elapsed interval.
-
Draw and measure the current vector. Draw a straight line from the DR endpoint to the observed fix. That line is the current vector. Measure its true bearing from north — that bearing is the set. Measure its length in nautical miles, then divide by elapsed hours to get drift in knots.
Component math alternative (for spreadsheets and calculators):
When you need precision beyond what a pencil and ruler provide, decompose the vectors into east/north components. Practical calculators use exactly this approach:
- DR east = DR distance × sin(course°)
- DR north = DR distance × cos(course°)
- Current east = observed east − DR east
- Current north = observed north − DR north
- Set = atan2(current east, current north), normalized to 0°–360°
- Drift = √(current east² + current north²) ÷ elapsed time
Once you have set and drift, you can apply the current vector in reverse to compute the required heading: steer into the current by the same angle the current would otherwise push you off course. Your EP (estimated position) for future planning uses the same vector added forward from your current fix.
Worked example: plotting set and drift from a real scenario
Initial conditions:
- Start position: 36°30.0’N, 075°40.0’W at 0800
- Course steered: 045°T
- Speed through water: 5.0 kn
- Elapsed time: 1.0 h (0800 to 0900)
- Observed fix at 0900: 36°34.0’N, 075°35.5’W
Step 1 — DR distance: 5.0 kn × 1.0 h = 5.0 nm
Step 2 — DR endpoint: From 36°30.0’N, 075°40.0’W, advance 5.0 nm on 045°T.
- DR east = 5.0 × sin(45°) = 5.0 × 0.7071 = 3.54 nm east
- DR north = 5.0 × cos(45°) = 5.0 × 0.7071 = 3.54 nm north
Converting to approximate lat/lon (1 nm ≈ 1.0’ lat; 1 nm ≈ 1.38’ lon at 36°N):
- DR lat ≈ 36°30.0’ + 3.54’ = 36°33.5’N
- DR lon ≈ 075°40.0’ − (3.54 × 1.38)’ = 075°40.0’ − 4.88’ ≈ 075°35.1’W
Step 3 — Current vector (DR to fix):
- Fix: 36°34.0’N, 075°35.5’W
- Current north = 34.0’ − 33.5’ = +0.5’ (≈ 0.5 nm north)
- Current east = 35.1’ − 35.5’ = −0.4’ (≈ −0.29 nm west)
Step 4 — Set and drift:
- Vector distance = √(0.29² + 0.5²) = √(0.084 + 0.25) = √0.334 ≈ 0.58 nm
- Drift = 0.58 nm ÷ 1.0 h = 0.58 kn (round to 0.6 kn)
- Set = atan2(−0.29, 0.5) ≈ 330°T (northwest)
Final result: Set 330°T, Drift 0.6 kn.
Sanity checks: Your SOG from GPS should read close to 5.6 kn (water speed plus current component). A 330°T set off the North Carolina coast is plausible as a coastal counter-current. If the set pointed 090°T at 3.0 kn, you’d suspect a fix error or a timing mistake before accepting it.
Which tools make the calculation faster and more reliable?
The right tool depends on where you are and what you’re trying to confirm.
Manual tools:
- Nautical chart with a pencil, dividers, and parallel rulers or navigation triangles for plotting DR and fix
- Maneuvering board (DMAHC 5090 or equivalent) — a pre-printed polar plotting sheet that makes vector diagram work fast and accurate
- Radar plotting sheet — same concept as a maneuvering board, used at the chart table or radar console
- Dividers for measuring vector length against the chart scale
Digital tools:
- Online set and drift calculators such as the Set and Drift Calculator at CodingAce — enter course, speed, time, and fix coordinates; it returns set, drift, CMG, and SOG
- Dead-reckoning calculators like the one at ThisCalc — useful for quick sanity checks and training runs
- Spreadsheets implementing the east/north component formulas above — fast, repeatable, and easy to audit
- Drift distance calculators (e.g., OceanCalc) for confirming drift distance = current speed × time
Shortcuts worth knowing:
- On a maneuvering board, the time-speed-distance scale on the outer ring converts vector length to knots without separate arithmetic.
- To convert minutes to decimal hours quickly: divide minutes by 60. Write it on the plotting sheet before you start.
- When working at small chart scales, measure vector length against the latitude scale (1’ = 1 nm), not the longitude scale, which compresses at higher latitudes.
When to prefer manual plotting: coastal piloting, any time you’re verifying electronics, SAR operations, and exam scenarios. Calculators are fine for passage planning and quick checks, but they cannot tell you when your fix is stale.
Common errors that corrupt your set and drift result
Most wrong answers trace back to bad inputs, not bad math. Here are the sources that matter most.
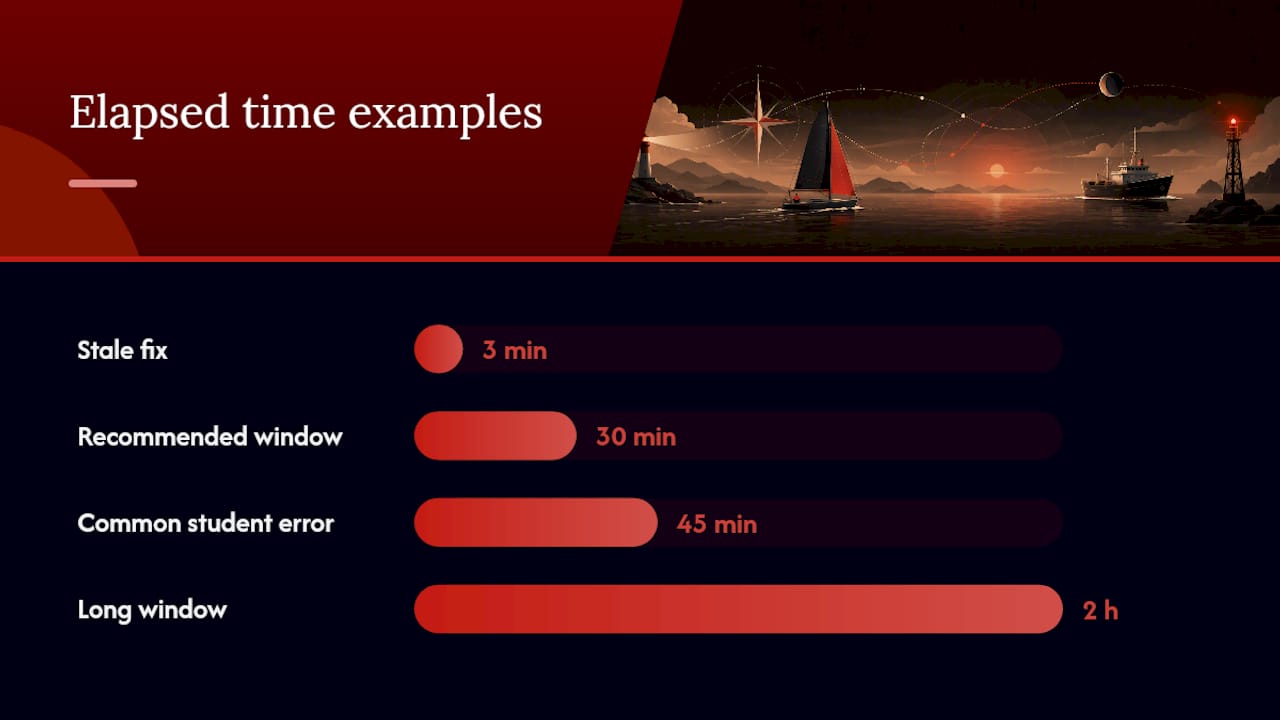
- Stale or inaccurate fixes. A GPS fix from three minutes ago is not the same as a simultaneous fix. In a 2-knot current, three minutes of drift moves you 0.1 nm, which can flip a set reading by 30° or more.
- Using SOG instead of speed through water. SOG already includes the current. Feeding it into the DR calculation double-counts the current and produces a meaningless vector.
- Wrong elapsed time. Confusing 0800–0845 as 45 minutes but entering 0.45 h instead of 0.75 h is a common student error. Always compute elapsed time in minutes first, then divide by 60.
- Ignoring leeway. In strong beam winds, leeway can reach 5°–10°. If you don’t correct your steered course for leeway before computing the DR, the residual error shows up in the current vector as phantom drift.
- Datum and projection mismatches. Plotting a WGS-84 GPS fix on a NAD-27 chart without applying the datum shift introduces a position error that can exceed 0.1 nm in some U.S. coastal areas. Always confirm chart datum before plotting.
How to catch these errors before they matter:
- Compare your calculated SOG (water speed + current component) against your GPS SOG. A large discrepancy signals a bad input.
- Take fixes from two independent sources (GPS + visual bearing) and compare them before committing to the current vector.
- Keep your elapsed-time window short. Thirty minutes in a tidal channel is more reliable than two hours, because tidal current direction and speed change over time.
- Record exact fix times to the minute in your log. Reconstructing elapsed time from memory is how small errors compound.
Pro Tip: Keep a dedicated plotting sheet for each watch, and write the elapsed time in decimal hours at the top before you begin. Catching a time-conversion error before the math starts costs nothing; catching it after you’ve altered course costs fuel and time.
How experienced navigators use set and drift proactively
Calculating set and drift after the fact is useful. Using it before and during a passage is what separates reactive steering from deliberate seamanship.

Experienced sailors plan their departure course and timing to spread the current’s effect across the whole passage rather than fighting it at the end. On a Gulf Stream crossing, for example, a navigator who knows the stream sets northeast at 2.5 kn will steer a course slightly south of the rhumb line from the start, letting the current carry the vessel back toward the intended track progressively. Waiting until the destination is close and then making a large correction wastes fuel and time.
The same logic applies to tidal gates. If you know the flood sets 270°T at 1.8 kn for three hours, you can compute the total displacement (5.4 nm west) and choose a departure time that puts that displacement in your favor rather than against you.
Verification habits matter just as much as planning. Periodic manual plots, done every 30–60 minutes on a busy coastal passage, confirm that your electronic chart plotter is working from accurate inputs. Marine Rescue Ballina’s SAR guidance makes the point plainly: inaccurate input fixes produce inaccurate drift estimates, and in a search-and-rescue scenario that error can mean the difference between finding a person and missing them entirely.
One operational caution: set direction describes where the current is carrying you, not where it is coming from. A set of 090°T means the current is pushing you east. Confusing set with current source direction causes navigators to apply heading corrections on the wrong side of a hazard. Write the definition on your plotting sheet if you’re new to the concept.
For passages crossing strong currents, always cross-reference your calculated drift against official NOAA tidal current predictions or a validated marine forecast before committing to a course. Manual calculations are only as good as the oceanographic reality they’re trying to model.
Quick-reference formulas and unit conversions
Copy these into your navigation log or laminate them for the chart table.
Core formulas:
- Drift (kn) = distance DR-to-fix (nm) ÷ elapsed time (h)
- Drift distance (nm) = current speed (kn) × time (h)
- DR distance (nm) = speed through water (kn) × time (h)
- Set (°T) = atan2(current east, current north), normalized to 0°–360°
Component decomposition:
- DR east (nm) = DR distance × sin(course°T)
- DR north (nm) = DR distance × cos(course°T)
- Current east = observed east − DR east
- Current north = observed north − DR north
- Vector distance = √(current east² + current north²)
Unit conversions:
The atan2 function returns a value in radians on most calculators and spreadsheets. Multiply by 180/π to convert to degrees, then add 360° if the result is negative to normalize to 0°–360° true.
Why manual skills still matter more than the tools
There’s a temptation, especially with capable chart plotters and connected AI assistants, to treat set and drift as something the electronics handle. They don’t, not fully. Every automated drift estimate is only as good as the fix quality and timing fed into it. The math is trivial; the discipline of recording accurate inputs is not.
Manual plotting builds the intuition that lets you recognize when an automated result is wrong. A navigator who has drawn a hundred current vectors on a maneuvering board knows immediately when a calculated set of 180°T in a northward-flowing coastal current deserves a second look. That pattern recognition doesn’t come from watching a screen update.
Nausika is built around this same philosophy: validated, real-time marine data should support your judgment, not replace it. The assistant knows your preferences and your route. It doesn’t know the water until you give it grounded data to work with.
Real-time currents and validated data with Nausika
Accurate set and drift calculations depend entirely on the quality of the data you feed them. Stale current tables and generic forecasts introduce the same errors as a bad fix.

Nausika connects your AI assistant to validated, real-time marine data, including live current vectors, tidal predictions, and verified routing information sourced directly from authoritative marine datasets. Instead of estimating drift from a tide table printed last season, you get current data your AI assistant can actually use. The workflow stays inside the tools you already know, with no new app to learn. During the public beta, access is free. When you’re ready to stop guessing at current inputs and start calculating from verified data, explore Nausika and connect it to your assistant in minutes.
Sources
- Set and drift
- Finding the set, rate and drift of a current | Nautical Science Grade 11
- Cruising Tips: Understanding set and drift tactics
- Set and Drift Calculator
- Dead Reckoning Calculator - Set & Drift | ThisCalc