The LogProduct
Vector vs Raster Charts for Sailors: Which to Use
Discover why sailors should choose vector charts over raster charts for safe navigation, including scalability and real-time data benefits.
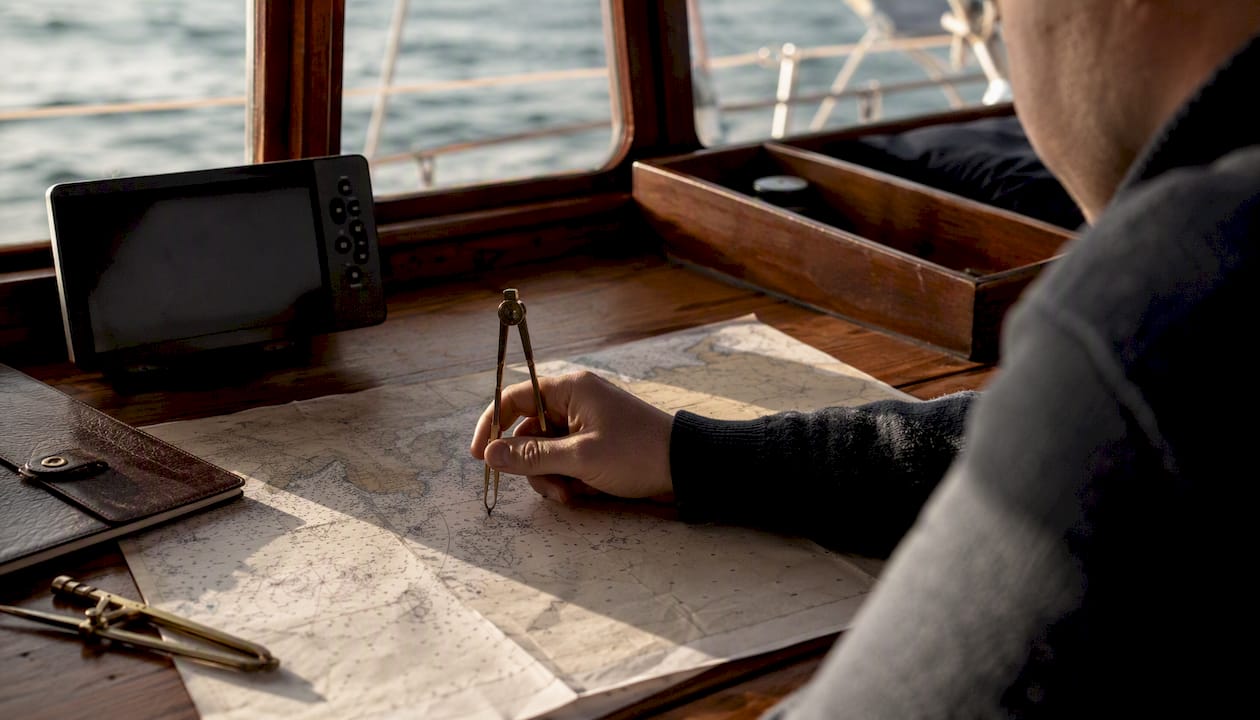
For routine safe navigation in U.S. waters, use official ENCs (vector charts) as your primary source. Keep an up-to-date raster chart or paper backup as an independent check. NOAA retired its raster nautical charts in January 2025, making ENCs the sole official chart product for American waters. That shift isn’t just administrative. It reflects what ENCs actually do better.
Three reasons ENCs belong at the top of your chart stack:
- Scalability without distortion. ENCs store features as mathematical objects, so zooming in on a tight harbor entrance doesn’t degrade the image. Raster charts pixelate when you push past their native scale.
- Interactivity and alarms. Click a buoy on an ENC and you get its full attribute data: light character, height, range. More importantly, a certified ECDIS can run look-ahead safety checks and trigger alarms that raster charts simply cannot support.
- Regulatory acceptance. Under SOLAS, ENCs on a type-approved ECDIS are the legally accepted primary chart for commercial vessels. For recreational sailors in U.S. waters, ENCs are now the official product.
Safety rule of thumb: For pilotage and port entry, run your ENC at or near its reference scale and cross-check visually. For offshore passages, ENCs give you the best automation and alarm coverage. Always carry an independent backup, whether a second device, a printed chart, or a current raster file.
Key Takeaways
For U.S. sailors, ENCs are the official primary chart product as of January 2025, and their structural advantages over raster charts make them the right choice for primary navigation at every task level.
| Point | Details |
|---|---|
| ENCs are the U.S. standard | NOAA retired RNCs in January 2025; ENCs are now the sole official chart product for American waters. |
| Raster charts pixelate and can’t query | RNCs have no object attributes and degrade when zoomed past their native scale. |
| ENCs enable alarms and safety checks | Object-level data under S-57/S-101 standards lets ECDIS systems trigger anti-grounding alarms that RNCs cannot support. |
| Always carry an independent backup | Keep a current paper chart or raster file on a separate device, updated to the same NTM date as your primary ENC. |
| Nausika adds the live data layer | Nausika connects verified marine forecasts and routing data to your AI assistant, complementing your official ENC baseline. |
Table of Contents
- What raster and vector nautical charts actually are
- How raster charts work, and where they fall short
- How vector charts work, and what the standards mean for you
- Head-to-head: how the two formats compare across dimensions that affect safety
- When to use each chart type: task-based guidance
- What plotters and apps can read: formats and compatibility checks
- Keeping charts current: update cadence and a practical checklist
- How to tell whether a chart file is raster or vector
- How real-time validated routing complements your official charts
- A navigator’s honest take on choosing between formats
- Nausika complements your official charts with live marine data
- Sources
What raster and vector nautical charts actually are
The terms “raster” and “vector” describe how chart data is stored, and that storage method determines almost everything about how a chart behaves on your plotter.
A Raster Nautical Chart (RNC) is a georeferenced scan of a paper chart. Think of it as a very precise photograph of the printed chart, locked to real-world coordinates. Every piece of information, a depth sounding, a buoy symbol, a caution note, exists as a colored pixel. There is no underlying database. RNCs carry no machine-readable attributes; your plotter can display them, but it cannot query them.
An Electronic Navigational Chart (ENC) is a structured vector database. Each navigational object, a depth contour, a light, a traffic separation scheme, is stored as a discrete feature with a set of attributes. Zoom in on a buoy and the object is still a buoy, with a position, a light character, and a range value your software can read and act on.
The practical difference shows up immediately. On an RNC, a depth contour is a line of pixels. On an ENC, that same contour is an object with a depth value your ECDIS can compare against your vessel’s draft to trigger a warning. Same visual result on screen, completely different capability underneath.
How raster charts work, and where they fall short
RNCs are made by scanning official paper charts at high resolution, then georeferencing the image so it aligns with real-world coordinates. The result looks exactly like the paper chart you grew up reading. That familiarity is a genuine strength, especially for sailors who learned navigation on paper and can read traditional symbology without thinking.
Strengths for mariners:
- Immediate visual familiarity; no retraining required to read symbols and color conventions
- Faithful reproduction of the paper chart’s content, including notes, cautions, and inset diagrams
- Works on low-end plotters that may not support full ENC rendering
- Useful as an independent visual backup when you want a second opinion that looks nothing like your primary ENC display
Limitations that matter for safety:
- Fixed native scale; zoom past it and the image pixelates, as any pixel-based image does when scaled beyond its resolution
- No object attributes; you cannot click a light and get its character, range, or sector information
- No support for ECDIS alarms, anti-grounding cones, or look-ahead safety functions
- Updates require a full chart replacement rather than a targeted object patch
NOAA distributed RNCs as BSB-format files (.KAP extension). With the January 2025 retirement, those files are no longer updated. Any RNC you use today is a snapshot of the chart as it existed at the time of its last revision. That’s a meaningful limitation in areas with active dredging, new obstructions, or recent buoy changes.
How vector charts work, and what the standards mean for you
ENCs store every navigational feature as a discrete object with attributes, governed by a set of IHO standards that determine how data is structured, displayed, and distributed. Understanding those standards helps you know what you’re trusting when you load an ENC.
The standards stack:
- S-57 is the data standard that defines how features and attributes are encoded. Most ENCs in use today follow S-57 Edition 3.1.
- S-101 is the next-generation data standard, with richer attribution and improved support for new feature types. Adoption is underway but not yet universal.
- S-52 governs how ENCs are presented on screen, defining the color palette, symbol set, and display rules that certified ECDIS systems must follow.
- S-63 is the data protection standard, controlling encryption and licensing so only authorized users can access chart data.
Because ENCs follow these IHO standards, a certified ECDIS can trigger alarms and perform look-ahead safety checks that raster charts cannot support. Your system knows the depth value of every contour, the air draft of every bridge, and the restricted status of every zone. It can compare those values against your vessel’s parameters in real time.
Practical advantages:
- Scales without pixelation at any zoom level, because features are stored as mathematical paths and coordinates
- Queryable objects: click any feature to see its full attribute set
- Layer control: toggle traffic separation schemes, depth contours, or light sectors on and off
- Seamless coverage across chart boundaries; no visible seams when adjacent ENCs are loaded together
- Supports ECDIS anti-grounding alarms, safety depth highlighting, and CATZOC quality indicators
One honest caution: Vector charts can look noticeably different from traditional paper charts, especially when over-zoomed or when rendering parameters are adjusted. A sailor accustomed to paper symbology may find the ENC display disorienting at first. Vendor rendering differences add another layer of variability; the same ENC can look different on two different plotters. Training on your specific system’s display settings matters more than most sailors realize.
Head-to-head: how the two formats compare across dimensions that affect safety
| Dimension | RNC (Raster) | ENC (Vector) |
|---|---|---|
| Appearance | Identical to paper chart; immediately familiar | Stylized vector display; may differ from paper |
| Scalability | Pixelates beyond native scale | Scales without loss at any zoom level |
| Interactivity | No clickable attributes | Full object query; depth, light character, restrictions |
| Layer control | None; fixed image | Toggle depth contours, lights, zones, and more |
| Regulatory acceptance | No longer updated by NOAA (retired Jan 2025) | Official U.S. chart product; SOLAS-accepted on ECDIS |
| Update method | Full chart replacement | Targeted object patches; monthly ENC update packets |
| File types | .KAP (BSB raster); GeoTIFF-like structure | cell bundles (S-57); S-63 encrypted packages |
| Compatibility | Older plotters; some apps | Modern chartplotters, ECDIS, and most current apps |
| Best for | Independent visual backup; familiarity check | Primary navigation, alarms, route planning, ECDIS |
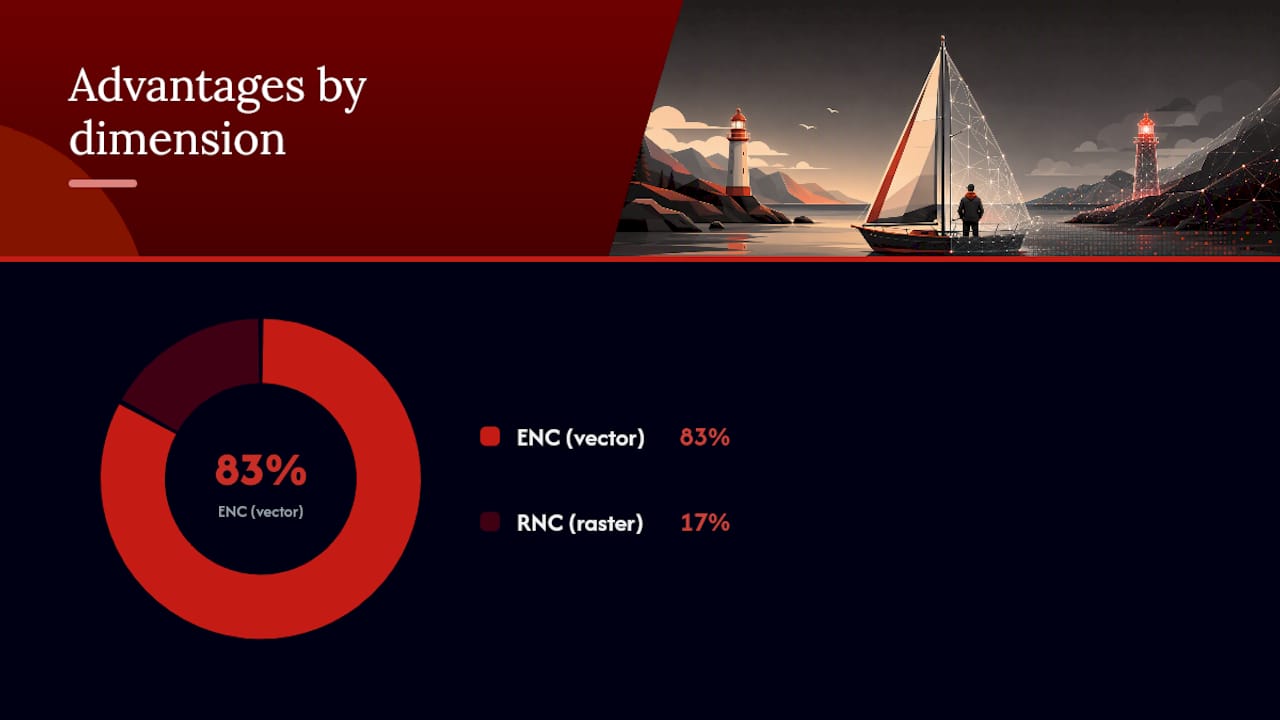
The table makes one thing clear: ENCs offer operational advantages on most dimensions except visual familiarity. That familiarity gap is real but trainable. The safety gaps in raster charts are structural.
When to use each chart type: task-based guidance
Chart choice should follow the task, not habit. Here’s how to think about it by navigation scenario.
Pilotage and port entry: Use your ENC at or near its reference scale. The object-level data, depth contours, restricted zones, and light attributes, is most valuable precisely when margins are tightest. Cross-check visually against buoys and landmarks. Do not zoom in past the reference scale and treat the display as authoritative.
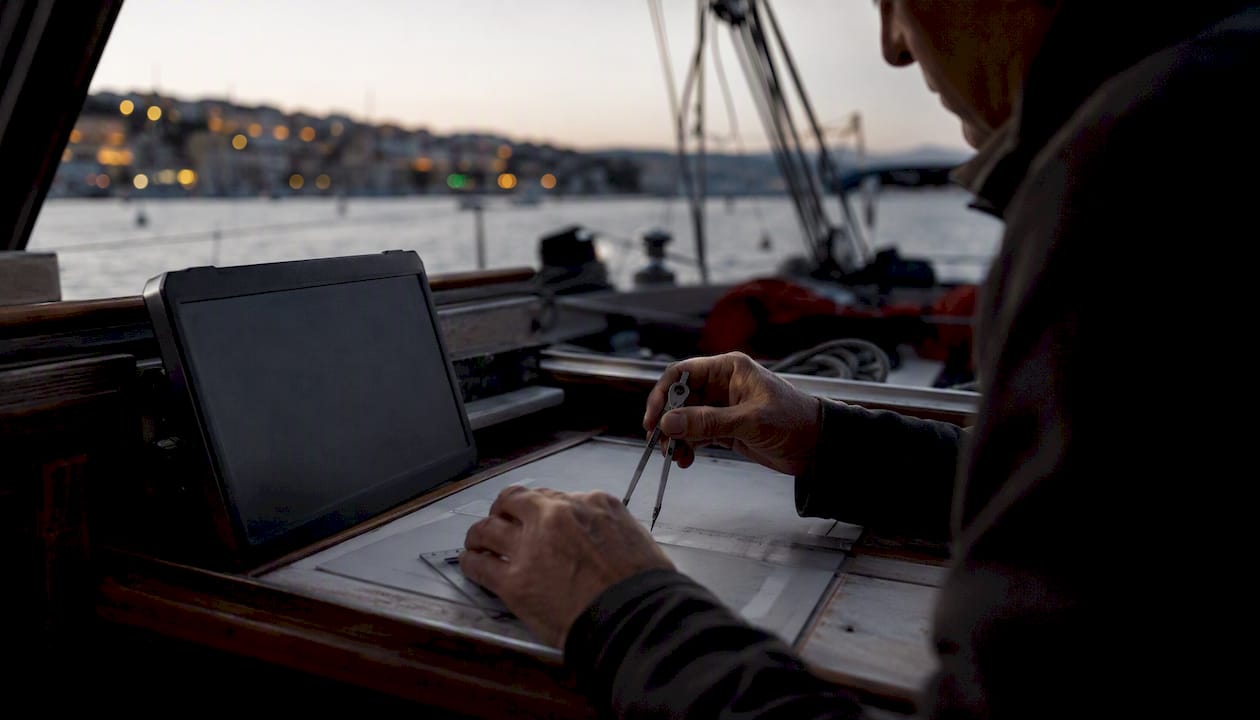
Coastal navigation: ENCs are the right primary tool. Alarm functions and seamless coverage across chart boundaries reduce the workload on coastal passages where you’re transitioning between multiple chart panels.
Offshore passage-making: ENCs give you the best automation coverage. Anti-grounding alarms and look-ahead safety checks are worth more offshore, where a watch-keeper may be tired and visual cross-checks are limited.
Route planning at the chart table: Either format works for initial planning, but ENCs let you query waypoints against depth and restriction data before you leave the dock.
Backup: Keep an independent backup in a different format on a different device. A current paper chart or a raster file on a tablet that runs independently of your primary plotter is the right redundancy model.
Safety checklist regardless of format:
- Verify charts are current before departure; check the update date on every chart panel
- Apply all outstanding Notices to Mariners and Local NTMs
- Cross-check electronic charts against radar and visual bearings at key waypoints
- Never rely on a single electronic source; maintain an independent backup
- Note CATZOC quality indicators on ENCs; a Zone D or E rating signals unreliable survey data
Red flags that should make you revert to paper or a backup format:
- ENC coverage is missing or shows a large uncharted area
- CATZOC indicators show poor survey reliability in your planned track area
- Your plotter shows a “chart not installed” or “chart expired” warning
- You are in an area with known recent changes not yet reflected in your current update
Pro Tip: Before any passage, zoom your ENC to pilotage scale on the most critical waypoints and confirm the depth contours and hazard objects display correctly. A chart that looks fine at passage scale can reveal missing data at harbor-entry scale.
What plotters and apps can read: formats and compatibility checks
Most modern chartplotters and navigation apps support ENCs, but the implementation varies. Here’s what to check on your system before you rely on it.
ENC distribution and file formats: ENCs are distributed as cell bundles with a .000 primary file and numbered update files (.001, .002, etc.). Official ENCs from NOAA are available free of charge through the Office of Coast Survey. S-63-encrypted ENCs from commercial distributors require a license key tied to your hardware ID.
RNC formats: NOAA’s BSB raster files used the .KAP extension. Since NOAA retired its RNC products in January 2025, any .KAP files you have are no longer receiving updates. Some apps still display them, but treat them as historical reference only.
Compatibility checks to run before departure:
- Load an ENC cell and click a buoy or depth contour. If you get an attribute panel, your system is reading vector data correctly.
- Zoom in well past the chart’s reference scale. If the image pixelates, you may be viewing a raster overlay rather than a true ENC.
- Look for a layer or display settings menu. ENCs support toggling feature categories; if no such control exists, your app may be rendering a simplified or raster-based chart.
- Check the update or verification screen. A properly installed ENC will show a cell edition number and an update number. Confirm both match your latest download.
Consumer chartplotters from major manufacturers generally support both formats, though ENC rendering quality varies. Professional ECDIS systems certified to IEC 61174 must meet strict S-52 display requirements. Recreational apps vary widely; some render ENCs with full attribute support, others display a simplified vector tile that looks like an ENC but lacks the underlying S-57 object structure.
Keeping charts current: update cadence and a practical checklist
An outdated chart is a hazard regardless of format. ENCs and RNCs have different update mechanisms, and the process for staying current differs meaningfully between them.
ENC updates: NOAA issues ENC update packets on a roughly weekly basis. Each packet contains only the changed objects, so updates are small and targeted. Commercial distributors using S-63 encryption push updates through their own servers, typically on a monthly schedule. Your chartplotter or navigation software should have an update function that connects to the appropriate server and applies patches automatically or on demand.
RNC and paper chart updates: Because RNCs are pixel images, any change requires a new edition of the full chart file. NOAA no longer issues RNC updates. Paper charts are corrected through Notices to Mariners (NTMs), published weekly by the National Geospatial-Intelligence Agency (NGA), and through Local Notices to Mariners (LNTMs) issued by each U.S. Coast Guard District.
Practical update checklist before departure:
- Open your chart management software or plotter’s update menu and check the last update date for every ENC cell on your planned route.
- Download and apply any pending ENC update packets from NOAA or your licensed distributor.
- Check the NGA weekly Notice to Mariners for your cruising area at nga.mil.
- Check the relevant Coast Guard District’s Local Notice to Mariners for recent buoy changes, temporary restrictions, and new hazards.
- Log the update date, edition number, and NTM number applied in your vessel’s chart log.
- Verify the update installed correctly by checking the cell edition and update number on your plotter’s chart information screen.
- Confirm your backup chart (paper or raster) reflects corrections through the same NTM date as your primary ENC.
How to tell whether a chart file is raster or vector
You don’t always know what you’re looking at when a chart loads on a new device or app. These checks take less than two minutes.
File and package clues:
.000file with numbered companion files (.001,.002) in a folder named with a cell identifier: almost certainly an S-57 ENC.KAPfile: BSB raster format (RNC)- An S-63 license file (
.permitor.lic) alongside the chart data: encrypted ENC distribution - GeoTIFF or similar image file: raster
Behavioral checks on your plotter or app:
- Zoom in heavily. Raster charts pixelate; vector charts retain clean lines and readable text at any scale.
- Tap or click a navigational object (buoy, depth contour, light). If an attribute panel appears with data fields, you have a vector ENC. If nothing happens, you have a raster chart.
- Look for a display settings or layer control menu. ENCs support it; RNCs do not.
- Check the chart information screen for “ENC” or “S-57” in the format field.
Log what you find:
- Note the chart type, cell or file name, edition number, and update date in your passage log
- Record which format was used as primary and which as backup
- Flag any cells where the format was ambiguous or where attribute queries returned no data
How real-time validated routing complements your official charts
Official charts, whether ENC or RNC, are the legal and navigational baseline. They tell you what the water looked like when the survey was conducted. What they cannot tell you is what the water is doing right now.
A practical workflow that many sailors are moving toward:
- Official ENC as the legal baseline. Load current, updated ENCs as your primary chart source. This satisfies regulatory requirements and gives you the best object-level safety data.
- Real-time routing and forecasts as the operational layer. Live wind, current, and weather data layered over your chart plan lets you optimize the route within the safe corridor the ENC defines.
- Human judgment as the final check. No tool, chart, or forecast replaces the watch-keeper’s eyes and the skipper’s decision.
Here’s a concrete example. You’re planning a coastal passage from Chesapeake Bay to Cape Hatteras. Your ENC shows the route is clear of charted hazards at your draft. But a live marine forecast shows a fast-moving squall building off the Outer Banks in the afternoon window you planned to round the cape. A real-time routing layer lets you see that leaving two hours earlier keeps you ahead of the system, while the ENC confirms the alternative anchorage at Ocracoke has sufficient depth for your vessel.
Nausika connects validated marine data, live forecasts, tide predictions, and harbor information directly into your AI assistant, sourced from verified marine datasets rather than generated content. It’s designed to sit alongside your official charts, not replace them.
Nausika pulls from verified marine sources to give you routing and forecast data your ENC can’t provide: live wind, current conditions, and harbor intelligence, all grounded in real data. The chart tells you where the rocks are. Nausika tells you what the weather is doing while you’re trying to avoid them.
A navigator’s honest take on choosing between formats
The debate over vector vs raster charts often gets framed as a technology question. It isn’t. It’s a safety question with a clear answer that most experienced navigators have already reached: ENCs first, backup always.
What I find underappreciated is the familiarity trap. Sailors who learned on paper charts sometimes resist ENCs because the display looks different. That resistance is understandable, but it’s worth examining. The visual difference between an ENC and a paper chart is a training problem. The inability of a raster chart to trigger an anti-grounding alarm is a structural problem. One of those is fixable with an afternoon of practice. The other isn’t fixable at all.
The over-zoom risk on ENCs is real, though. A vector chart that looks detailed at high zoom may be showing you interpolated data beyond its reference scale, not surveyed reality. The reference scale indicator on your ECDIS or plotter exists for a reason. Treat it like a speed limit in fog: you can exceed it, but you’re accepting risk you may not be able to see.
For harbor work, I want the ENC’s attribute data and alarm functions. For a coastal daysail, I run ENCs as primary and keep a tablet with the relevant paper chart PDF as backup. For offshore legs, the ENC’s seamless coverage and look-ahead functions are genuinely hard to replicate any other way. The raster backup stays on a separate device, powered independently, updated to the same NTM date as the primary.
The one thing I’d tell any sailor moving from paper to electronic charts: spend time with your system’s display settings before you need them. Know what your reference scale indicator looks like. Know how to query an object. Know how to toggle layers. That’s not optional preparation. It’s the price of admission for using ENCs safely.
Nausika complements your official charts with live marine data
Charts show you the fixed picture. Nausika fills in what’s moving.
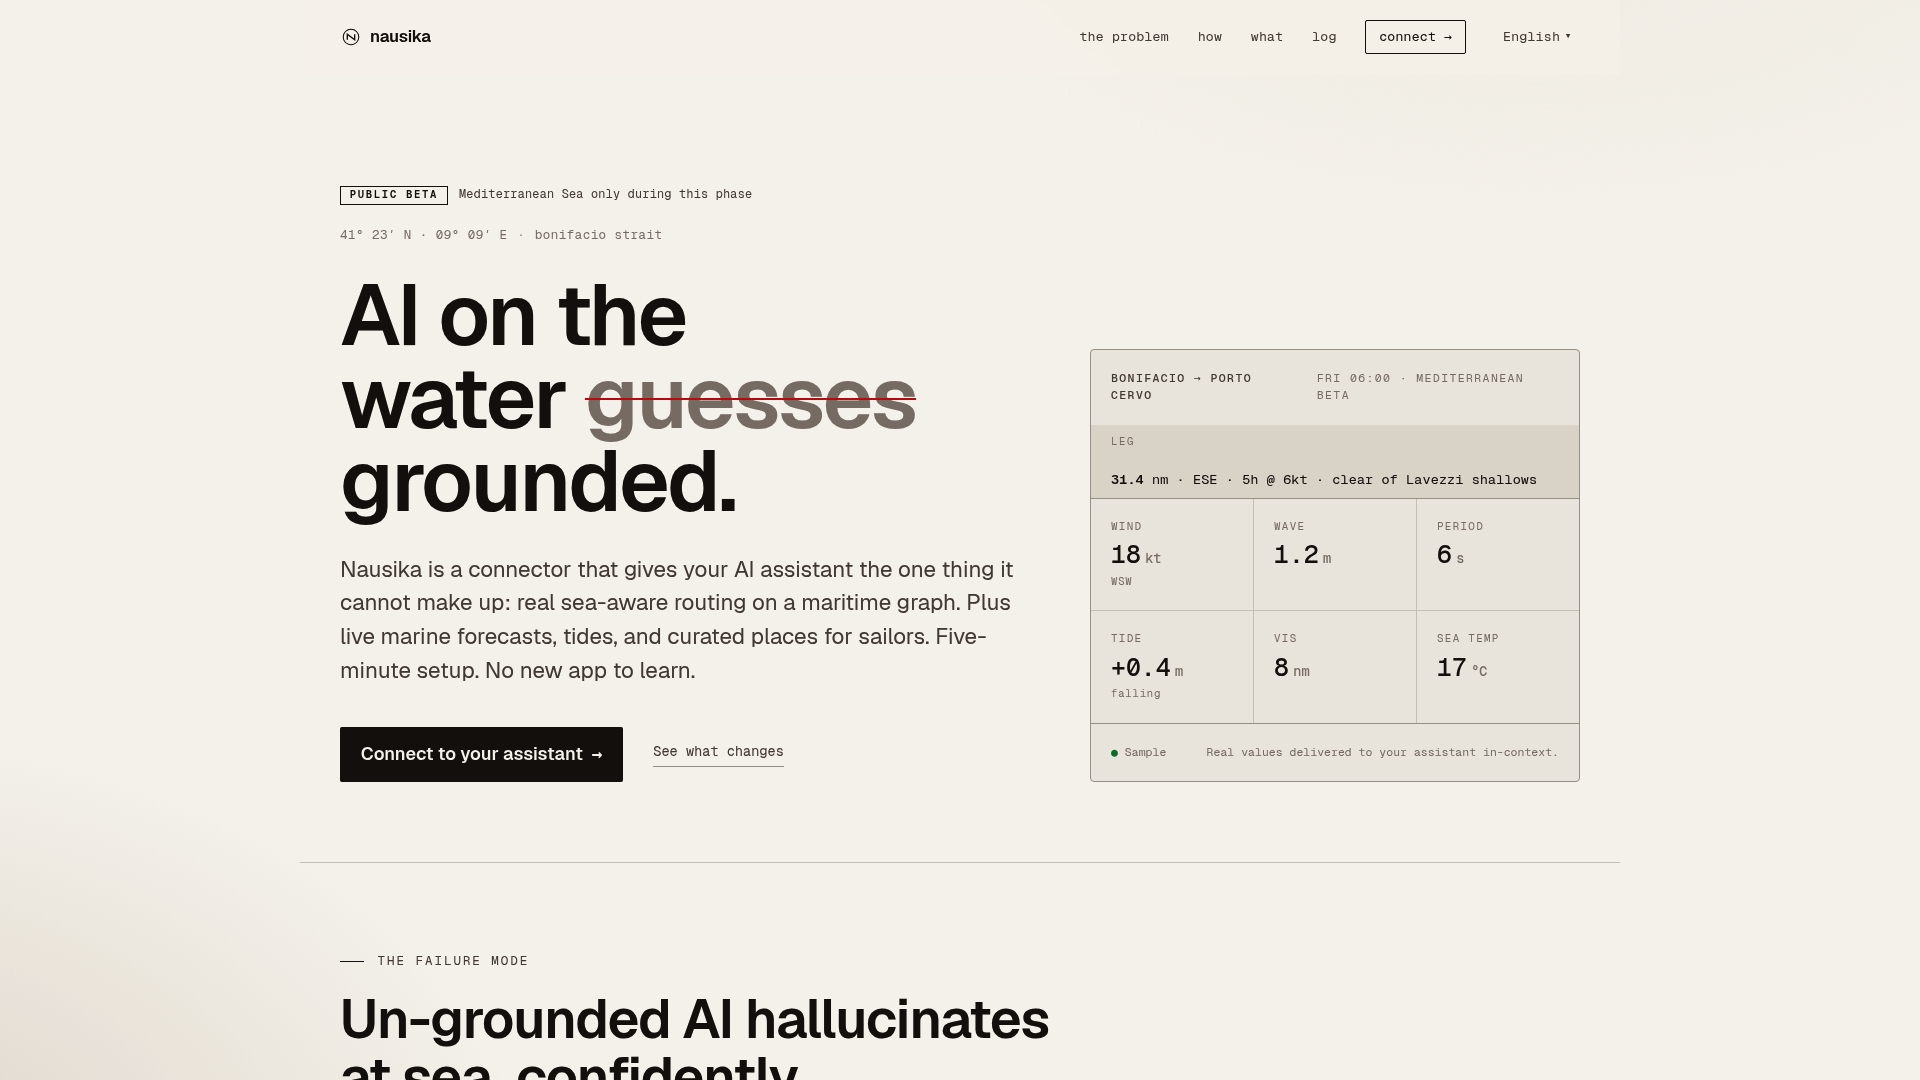
Nausika integrates validated marine data, including live forecasts, tide predictions, and curated harbor intelligence, directly into your existing AI assistant. No new app to install. No learning curve. The data comes from verified marine sources, not AI-generated estimates, so you can trust what you’re seeing when you’re planning a passage or looking for shelter.
The workflow is straightforward: use your official ENCs as the legal and safety baseline, then layer Nausika’s real-time routing and forecast data to make the best decision within that safe corridor. You can review Nausika’s data provenance and sources to understand exactly where the information comes from before you rely on it.
Ready to add a validated data layer to your chart workflow? Start with Nausika during the public beta, currently free to access.
Sources
Consult your flag state’s carriage requirements and the relevant Notices to Mariners for legal obligations specific to your vessel class and route. The sources below are the official and authoritative references used in this article.
- NOAA — Farewell to traditional nautical charts
- What is the difference between a raster chart and a vector chart? — CHS
- Raster vs. vector — University of Michigan Library guides