The LogProduct
Protect Moorings: Harbor Surge Index for Boaters and Harbormasters
Learn to read the Surge Current Index, use PacIOOS forecasts, and turn warnings into concrete actions that protect moorings, fenders, and docks.
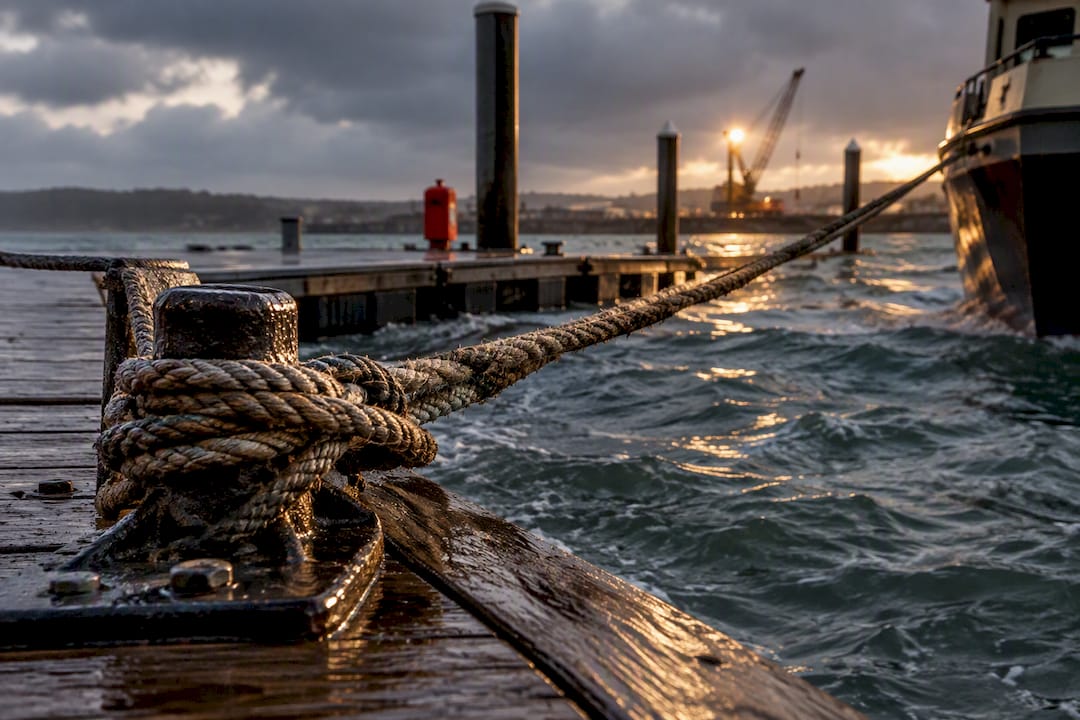
Harbor surge is a long-period, wave-driven oscillation, usually lasting one to sixty minutes, that pushes strong horizontal currents through a harbor even when the vertical rise looks minor. It differs from storm surge, which is the broad, tide-raising flood from a tropical cyclone that NOAA maps at a regional scale. Before you cast off or make a mooring decision, pull up your harbor’s Surge Current Index at PacIOOS or check your local harbor bulletin.
TL;DR:
- Harbors with narrow entrances or complex shapes are more prone to violent oscillations even with small surge currents, which can damage moorings and docks.
- The Surge Current Index blends observed and forecast swell energy, with a red line indicating historically damaging levels, but local validation remains essential.
- Surge currents often cause hidden damage such as line chafe and fender failure, particularly at berths near the harbor entrance where energy concentrates.
- Regularly inspecting moorings and adjusting positions before conditions worsen can prevent most damage caused by harbor surge oscillations.
- Using localized, hourly-updated harbor forecasts alongside tide and wave planning improves decision-making and reduces risk during surge events.
Table of Contents
- Why Harbors Resonate: Geometry, Waves, and Hidden Currents
- How Does the Surge Current Index Forecast Actually Work?
- What Does Harbor Surge Actually Damage?
- Where Do You Check for Live Harbor Surge Forecasts?
- What Should Boaters and Harbor Managers Do Before a Surge?
- Turning Forecasts Into Decisions: Where Nausika Fits
- Practitioner Perspective: Monitoring Beats Concrete
- Nausika: Validated Harbor Data Where You Already Work
- Sources
- FAQ
Why Harbors Resonate: Geometry, Waves, and Hidden Currents
A harbor behaves like an organ pipe filled with water. Its length and depth set a natural resonant period, and when incoming wave energy matches that period, the basin amplifies it into standing oscillations known as seiches. The energy driving this rarely comes from local wind swell. It arrives as infragravity waves, surf beat generated by distant storms, or occasionally the leading edge of a tsunami, and it can travel thousands of miles before it ever reaches your slip.
Basin shape decides how bad it gets:
- Narrow entrances concentrate flow and drive Helmholtz-mode resonance, the same physics that makes blowing across a bottle produce a tone.
- Breakwaters and vertical walls reflect energy rather than absorbing it, prolonging oscillations.
- Shallow, partially blocked entrances effectively shorten the harbor, shifting resonance to shorter periods that catch operators off guard.
That last point matters more than most skippers realize: a harbor that looks safe based on offshore wave period alone can still surge violently once entrance shear flow shortens its effective length. The real hazard isn’t wave height. A surge of roughly 0.3 feet vertically can still generate the horizontal current that snaps a mooring line, because it’s velocity, not elevation, that does the damage.
How Does the Surge Current Index Forecast Actually Work?
The index blends observed swell data with forecast swell energy, translating both into the infragravity energy likely to excite oscillation inside a specific harbor. Reading the plot takes a little practice, but the logic is straightforward once you know the color code.
- The dark blue line is the observed index, built from recent measurements.
- The cyan line is the current forecast, projecting where conditions are headed.
- A dotted line shows the previous forecast run, so you can gauge how much the model has shifted and how much to trust today’s projection.
Historical Damage Threshold: PacIOOS marks a red line on these plots that corresponds to index levels associated with past damaging events, with a shaded band below it flagging conditions that make navigation genuinely difficult even without full-blown damage.
Those thresholds aren’t arbitrary. They’re calibrated against actual harbor incident records, which is why local staff are still encouraged to validate the index against their own event history rather than treat the published line as universal. Forecasts typically update on an hourly cadence, but they remain experimental, and they go invalid the moment an active tsunami or tropical storm warning is in effect. Check the fine print before you rely on the number.
What Does Harbor Surge Actually Damage?
Surge currents don’t announce themselves the way a big wave does. They show up as chafed lines, crushed fenders, and boats slamming against pilings in water that looks almost calm from the parking lot.
- Mooring lines and cleats take the brunt of repeated horizontal loading, especially on boats with high freeboard that catch more current drag.
- Fenders compress and fail faster than owners expect, often mid-season rather than during an obvious storm.
- Fixed docks and finger piers can rack loose from cyclic stress even when no single surge event looks dramatic.
Haleʻiwa Harbor on Oʻahu is the textbook case PacIOOS built its public index around, with observed infragravity periods that regularly hit the range known to rattle small-craft basins. Santa Cruz and Ventura harbor bulletins have documented similar patterns: recovery periods stretching well beyond the surge event itself, with damage concentrated at berths nearest the entrance, where incoming energy is strongest before basin geometry has a chance to spread it out.
Where Do You Check for Live Harbor Surge Forecasts?
Match the forecast product to the scale of the threat you’re worried about.
- PacIOOS harbor surge pages give you localized, hourly-updated index plots built for the specific basin you’re sitting in, which is exactly what you want for day-to-day mooring decisions.
- NOAA and the National Hurricane Center publish national storm surge risk maps built on SLOSH model ensembles (MEOWs and MOMs), designed for hurricane-scale inundation planning rather than routine harbor oscillation.
- Local port and harbor bulletins can override both. Harbor staff often have on-the-ground observations the regional models can’t capture.
Use the harbor index for everyday operational calls. Reach for the national SLOSH-based maps when a named storm is approaching and the concern shifts from current strength to actual flooding.
What Should Boaters and Harbor Managers Do Before a Surge?
Turning an index reading into a decision is where most of the actual risk gets managed or missed.
- Inspect mooring lines, chafe gear, and fenders before conditions build, not after the index starts climbing.
- Reduce windage where you can. Furl sails, remove covers that catch current-driven surge, and stow loose gear on deck.
- Reposition to a more sheltered berth if the forecast gives you enough lead time and it’s still safe to move.
- Treat the shaded caution band on the index plot as your signal to stop transiting the harbor, not just a suggestion to slow down.
- Coordinate with harbor authorities once the index nears the historical damage threshold. They may already be adjusting slip assignments or entrance traffic.
After the event passes, walk the docks. Document any line failures, fender damage, or piling movement while it’s fresh, since that record is what lets your harbor calibrate its own local thresholds for next season.
Pro Tip: Don’t wait for the red line to act. The shaded caution band exists because plenty of real damage happens well below the historical threshold, especially on aging mooring hardware that’s already fatigued from smaller events.
Turning Forecasts Into Decisions: Where Nausika Fits
Reading an index plot is one skill. Turning it into a berth decision under time pressure is another. Some AI assistants integrate live marine forecasts and curated harbor information so a surge reading can be connected with routing and tide planning.
- Cross-check a rising Surge Current Index against a nearshore wave plan before deciding whether to reposition or ride it out.
- Pair index thresholds with a quick tidal window estimate using the Rule of Twelfths when timing a departure around a caution period.
A skipper watching a climbing index doesn’t need another app to learn. The data can be accessed within the AI assistant already open on the chart table.
Practitioner Perspective: Monitoring Beats Concrete
Expensive structural fixes, transverse piers, entrance modifications, get most of the attention in harbor design conversations. But routine monitoring paired with a simple operational checklist prevents more damage than any single retrofit, because most surge losses trace back to a mooring line nobody checked, not a harbor that needed rebuilding. Coupled numerical modeling is starting to expose blind spots empirical practice missed for decades, and that’s valuable. It still won’t replace a harbor master who reads the index every morning and acts on it.
— Andrea
Nausika: Validated Harbor Data Where You Already Work
Generic AI assistants guess at marine conditions. Some AI maritime tools replace guesswork with real-time, sea-aware routing and validated harbor data pulled straight from authoritative marine sources, avoiding hallucinated coordinates or invented anchorage depths. Users such as sailors, charter operators, and harbor planners can get forecast and shelter information integrated into their existing workflows without needing to learn a new app.
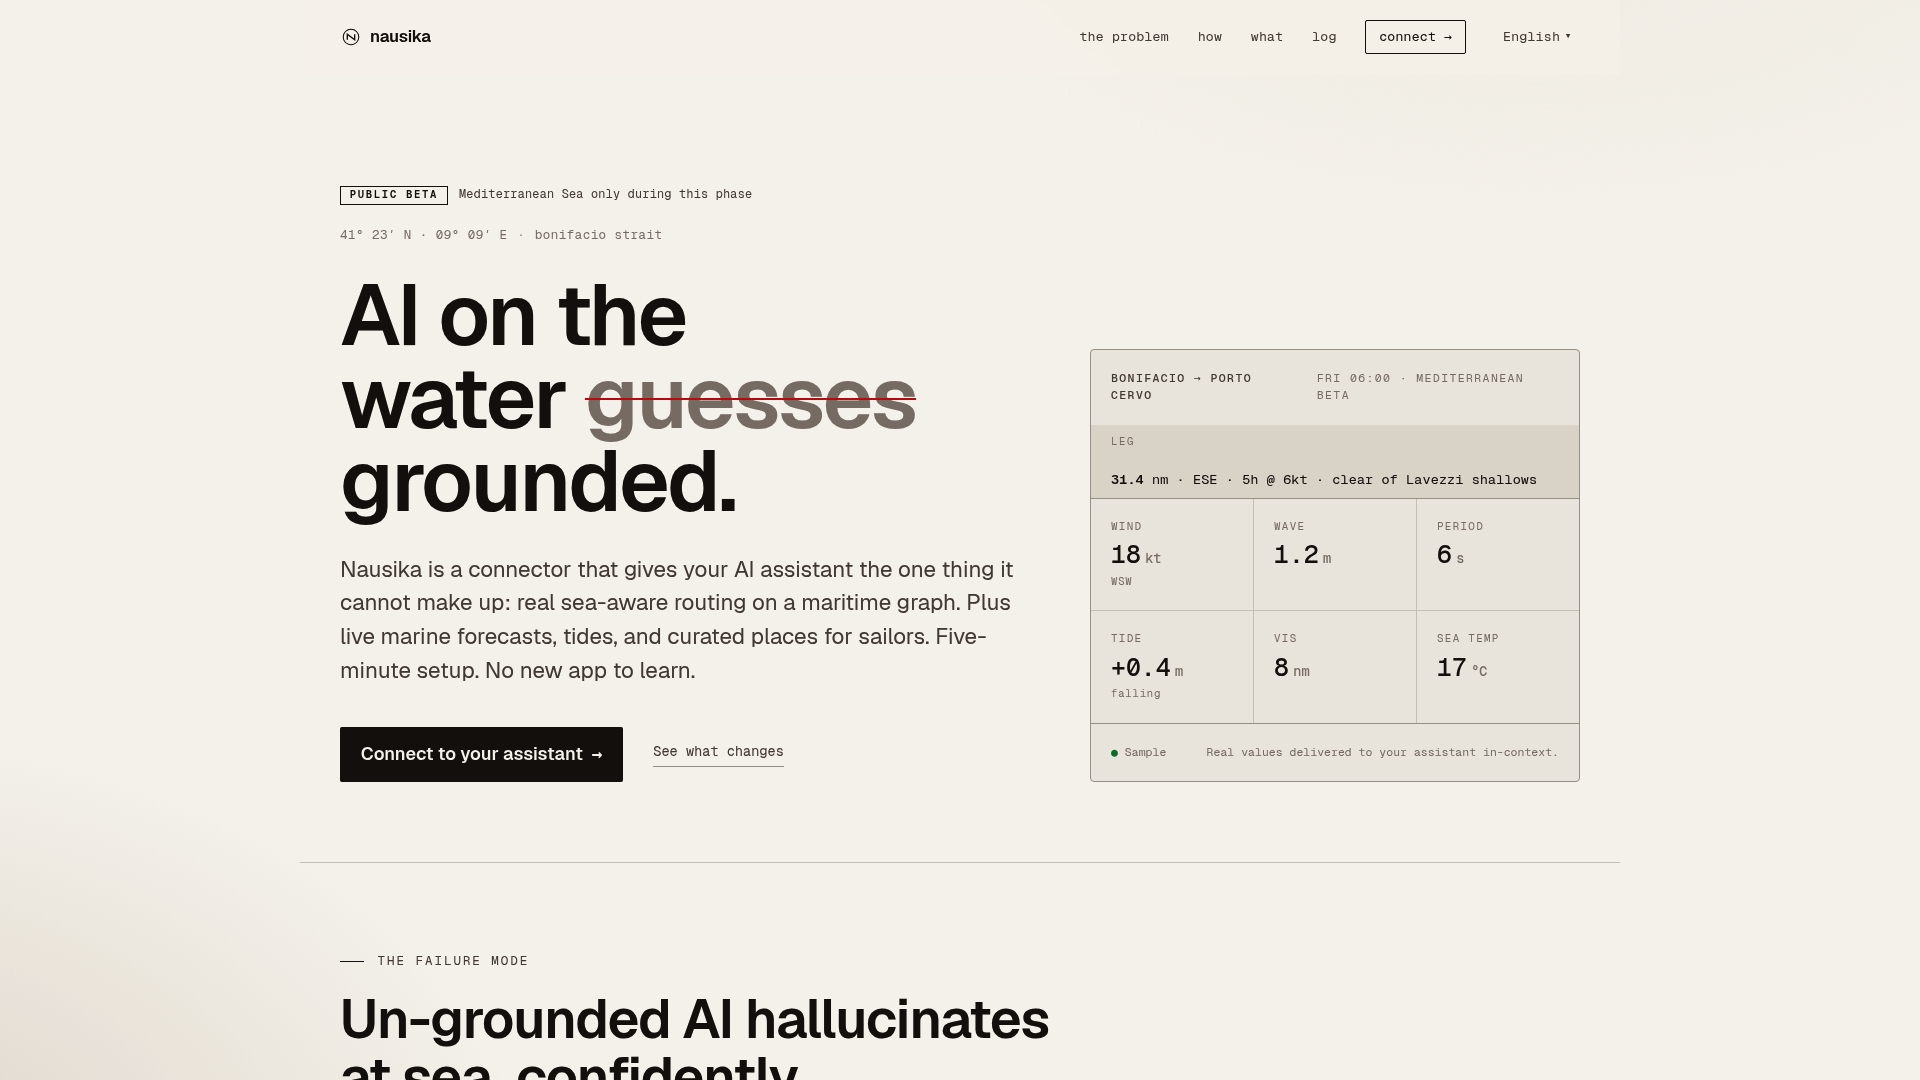
If you’re the one deciding whether to move a boat before an index climbs into the shaded caution band, that reliability is the whole point. The integration into existing AI assistants can be done efficiently, with free access offered during a public beta phase. Start using Nausika the next time you check conditions before heading out.
Sources
- Harbor resonance - Coastal Wiki
- Storm surge overview — NOAA / National Hurricane Center
- Harbor Surge Forecast : Haleʻiwa, Oʻahu — PacIOOS
- National storm surge risk maps — NHC/NOAA
FAQ
What Was the Deadliest Storm Surge in History?
Storm surge from tropical cyclones has caused some of the highest hurricane death tolls on record, which is why it’s treated as the leading cause of hurricane fatalities rather than a secondary hazard. Harbor surge, by contrast, is a localized current hazard that threatens vessels and docks rather than entire coastal populations.
Is a Harbor Surge the Same as a Tsunami?
No. A tsunami is a seismic or landslide-generated wave train that can excite the same harbor resonance mechanisms as ordinary harbor surge, but its source and scale are entirely different. That overlap is exactly why PacIOOS marks its harbor surge forecasts as invalid during an active tsunami warning.
What Does a 13 Foot Storm Surge Mean?
Storm surge means water levels are forecast to rise significantly above the normal predicted tide in that location, a regional flooding threat mapped using SLOSH-based national storm surge risk products. That figure describes large-scale coastal inundation, not the harbor surge currents covered by a local Surge Current Index.
How Long Does Harbor Surge Last?
Harbor surge oscillations typically run on periods of one to sixty minutes, but a given event can persist for hours as long as the incoming long-period wave energy keeps feeding the resonance. Basins with narrow entrances or strong shear flow can sustain oscillations even after the original forcing weakens, so a calm-looking harbor can still be surging well after the swell that triggered it fades offshore.
Does Nausika Provide Harbor Surge Forecasts?
Nausika integrates validated marine forecasts and curated harbor information into your existing AI assistant, giving you sea-aware context to interpret conditions like harbor surge alongside routing and tide planning. Current pricing details are available on the Nausika site.